 Our solutions
 Integrations
 Acomba
 SigaFinance
 AgExpert
 Get a free demo
 Talk to an expert
 Automation
 Intelligent search and document filing
 Financial indicators
 Dairy Indicators
 Mobile app
 Data capture
 Intelligent data recognition
 Automatic transfer to your accounting software
 Electronic Data Interchange (EDI)
 Real-time dashboard
 12 months overview
 Personalized indicators
 Document digitization
 Seamless and secure integration
 Informative annotations
 Useful links
 Help & Support
 Blog
Blog Customer login
 FAQ
FAQ Technical support
 Contact us
Dairy Indicators
Modified on: May 1, 2026Aleop’s dairy indicators make it possible to analyze the technical and economic performance of a dairy business using real operational data. They are based on the monthly consolidation of production volumes, milk sales, feed purchases, rations, and herd technical data in order to measure profitability and production system efficiency.
These indicators provide continuous monitoring of feed margin per cow, actual production per animal, and the overall performance of the business over a given period. The analysis is based on validated data that is comparable over time and representative of operational reality, enabling the quick identification of variances, trends, and the impact of management decisions made month after month.
Data Entry
Data collection and validation are essential steps in calculating dairy indicators. The quality of the information entered has a direct impact on the reliability of the results and helps prevent incorrect conclusions or bias in decision-making.
To obtain an initial result in the form of an indicator, production data for at least the past 12 months must be entered. After that, monthly updates require only a few minutes.
Accessing the module
The Dairy Indicators module is accessible from the Dashboard screen, under the Tools section. It is available only when the Dairy Indicators module is activated on the Aleop account.
In the Dairy Indicators dashboard, the latest data entry is identified by year and month. A color code allows for a quick assessment of data status:
- Green: Verified data
- Yellow: Data to be reviewed, but not directly affecting the calculation of indicators
- Red: Data to be reviewed and directly impacting the calculation of indicators

General information
This section is used to define the business profile. You must enter the date from which data compilation begins.
It includes three tabs:
- Business Information
- Herd composition
- Family consumption
Company information
This tab allows you to define the structural parameters of the business, including:
- Feeding system (individual, TMR, PMR)
- Concentrate types (complete feed, grains and supplements, single ingredients)
- Stabulation type (free stall, tie stall)
- Milking type (parallel parlor, rotary parlor, robotic rotary, milking robot, milking unit)
- Number of milking robots
- Milking session count
- Milking cow lactation stall count
Note: It is important to click the Save button after completing each tab.

Herd composition
This tab allows you to define the breed composition of the dairy herd. By default, the herd is set at 100% Holstein.
Available breeds are: Holstein, Jersey, Ayrshire, Brown Swiss, Guernsey, or Other. The Add line button allows you to add one or more breeds and assign a percentage to each.

Family consumption
This tab allows you to enter the daily milk consumption by the family or families, expressed in liters per day. This information has a direct impact on the calculation of dairy indicators. Other information in the General Information section is provided for reference only.

Commercial losses
This section allows you to record milk losses that could have been intended for human consumption but were not (for example, due to antibiotic treatment or processing for domestic use).
The purpose of this module is to collect additional information to assess the actual milk production per cow.
Note: Colostrum cannot be included, as it is not intended for human consumption.
A table summarizes the volumes of lost milk by month. To enter quantities:
- Click the Show button under the relevant month.
- Using the calendar, select one or more dates. To select multiple consecutive dates, click a date and hold the mouse button while dragging over the other dates. You can also select non-consecutive dates using Ctrl + clic, or select a range between two dates by clicking the first date and then using Shift + clic on the second.
- Enter the lost milk quantity or quantities.
Milk sales :
This module consolidates all information related to milk sales.
- The trash icon represents a manually entered milk sale that is not linked to a validated document. A milk statement can be entered manually even after the indicators are activated, for example, when the milk statement was not automatically extracted via OCR.
- After activation, information from milk statements is automatically transferred to the corresponding month.
- The magnifying glass icon indicates that the information has been transferred from a validated milk sales document directly through Aleop.
- It is possible to move a milk statement to the previous or following month, particularly if the statement date is incorrect. This action is only allowed if no sale is already recorded for the target month.
To view the milk statement associated with a month, click the magnifying glass icon. The document opens in full-page mode and can be enlarged to facilitate data validation.

Note: Component data must also be validated from the milk statement. A business that was using Aleop before activating the indicators does not need to validate past data but will need to do so once the feature is enabled.
An additional step is therefore added to the validation process to manage this information. Like financial data, this information is extracted automatically and must be validated.
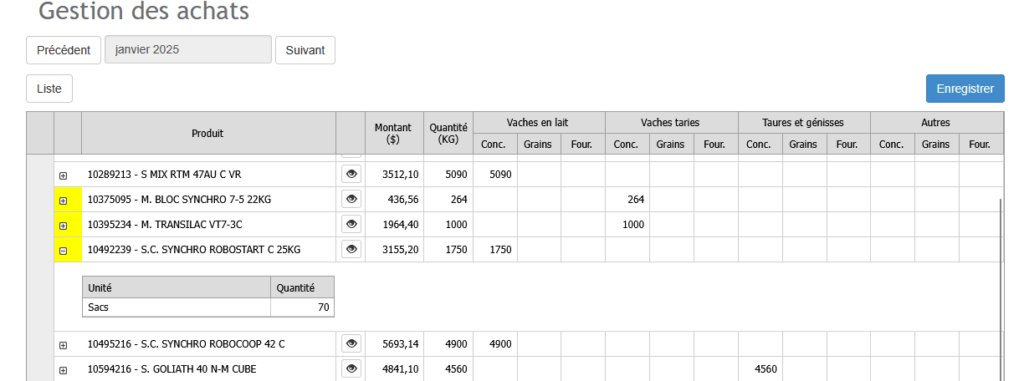
Purchases
This module is a central component of using Aleop as a dairy production management tool.
A summary table displays the quantities of feed purchased by supplier/partner. It is important to regularly check this module to validate new feed invoices.
- Pink-shaded icons indicate that new purchases have been made since the last distribution confirmation.
- The Show button allows access to the full table of feed purchased for the selected month.
- Feeds are organized by supplier and product.
Aleop automatically allocates purchased feed quantities according to the feed account mapping by animal category. The Aleop account primarily determines in which column the purchased amount of a product will be reported, while the mapping suggests the Aleop account during validation.
Feed purchases that have not been validated within Aleop and come directly from the accounting system appear in the Data from Accounting System section. To view these amounts, click the two-arrows icon. Note that if a user refreshes accounting system data for a given month, any previous allocations or modifications made to this data will be lost.
The drawback of not validating feed invoices in Aleop is that only the total monetary data is transferred by category, without quantity details.
The magnifying glass icon, located to the right of a feed item, allows you to view all documents for the month associated with that feed and download them. The “+” symbol displays the transferred units and quantities. A color indicator highlights units not recognized by Aleop during conversion to kilograms.

Purchase management
When purchasing feed, allocating quantities across animal categories can be complex in accounting. Aleop allows you to enter this allocation in quantities, which is then converted into percentages and recorded.
For the next purchase of the same product from the same supplier, Aleop will automatically suggest the last allocation used. This allocation can be modified at any time. Aleop always retains the most recently saved modification.
The Grains and Forages columns are reserved for purchases that supplement on-farm production and are used for feeding dairy cows.
Note: Quantities of grains and forages for lactating cows are entered in these columns only when a ration is associated. Otherwise, the quantities should be entered under Conc.
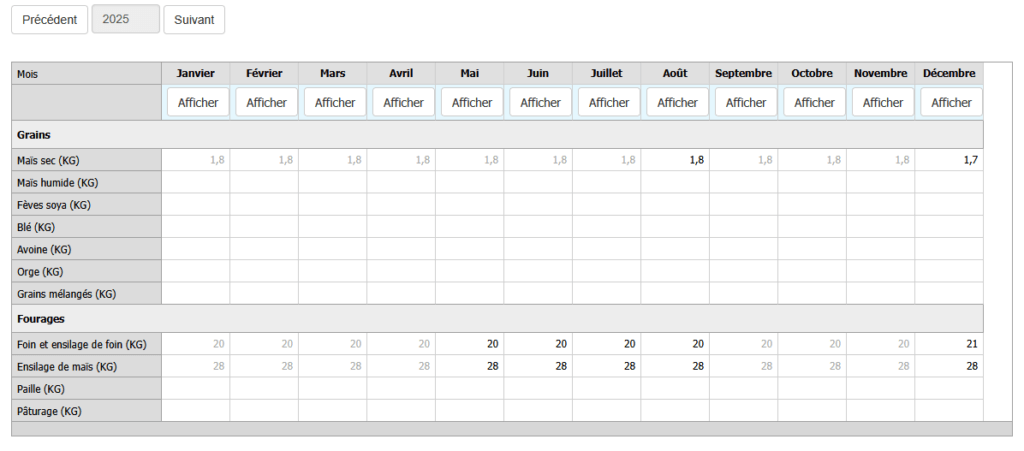
Feeding
The Feeding module is designed to assess the quantities of feed produced and used on the farm.
A summary table lists the main feeds that can be produced on the farm. Quantities represent daily rations per cow, expressed as served.
- Bolded rations indicate that modifications have been made for the month.
- Gray text indicates that the ration composition has been carried over from a previous month. The source month appears in black, and the ration can be carried over across multiple months.
To access the details of a ration, click the Show button under the desired month. Two tabs are available: Grains and Forages.
Feeding - Grains
To enter a grain ration:
- Click Add line.
- Select the grain from the drop-down menu.
- Enter the average quantity served per lactating cow
- Indicate the dry matter percentage.
A monetary value is assigned to the feed based on commercial crop producer prices in Quebec, by regional centers. This value cannot be modified and always corresponds to the- standard ingredient value for the selected month. De plus, la liste des ingrédients est fixe : il n’est pas possible d’ajouter des ingrédients personnalisés qui ne figurent pas dans la liste suggérée par Aleop.
Note: Do not forget to save before switching tabs.

Feeding - Forages
The principle is the same as for grains. It is recommended to use the Description column to specify the type of forage and the storage location.
Notes :
- Quantities entered are in as-fed tons (AF), and the dry matter percentage can be modified.
- The $/T DC price corresponds to a standard monthly price at 100% dry matter.
- The trash icon allows you to delete a line.

Reminders:
- Grains a ration is entered only if the business produces all or part of the grain being used.
- Forages rations are entered by forage type. Multiple lines can be added for the same type.
- Even if straw is not produced on the farm, the ration must still be entered if it is used for feeding.
Technical data
Technical data must be completed column by column, not row by row. The values entered must represent monthly averages for each month. They must be filled in every month for the indicators to function properly.
The most important data point is the average number of lactating cows per month.
To properly assess milk production per cow, it is also necessary to enter:
- The number of new heifers
- The average age at weaning
- The average daily milk consumption per heifer
Note: If heifers consume only milk replacer, enter 0 on the corresponding line.
Once the data has been entered for a month, the Copy button allows you to carry the information forward to the following month and modify only the elements that have changed.

Important information
- Pay particular attention to the three bottom modules: Purchases, Feeding and Technical data.
- The General information module contains structural data with little direct impact on the indicators.
- Milk sales : When the Tools section is activated, validating the milk statement in Aleop allows automatic data transfer. This has a significant impact on the indicators.
- Feed purchases :
- Validate quantities and dry matter percentages.
- Ensure proper allocation among animal categories.
- Enter quantities in the appropriate columns based on feed type.
- Use the Conc. column when there is no on-farm production.
- Feeding : Directly affects efficiency and feed margin.
- Technical data : The average number of lactating cows remains the key data point for the month.
Work methodology to keep indicators up to date
To ensure your dairy indicators accurately reflect the herd’s actual performance, it is essential to establish a monthly routine for updating data. This process involves entering or validating all missing information, synchronizing production and feeding data, and verifying the integrity of entries.
The optimal time to perform this update could be upon receiving your milk payment, as it occurs monthly, providing a regular and structured checkpoint. This procedure will take only a few minutes per month and will ensure that your dairy indicators remain up to date.
Steps to follow each month
- Herd data update
- Enter any changes in the herd’s technical data (entries, exits, lactations, inventories, etc.).
- Verify that all information is complete and accurate to ensure indicator reliability.
- Ration update
- Verify that rations are still valid and correct them if needed. A ration is automatically carried forward to the following month if it is not modified; therefore, data entry is required only when a change is needed.
- Adjust the data if modifications have been made to forages or supplements.
- Validation of financial documents
- Verify that all incoming documents are complete and properly recorded in Aleop.
- Identify and correct any inconsistencies or errors detected.
- Mark documents as validated once verification is complete.
- Verification of reported monthly milk sales values
- Compare milk sales data in Aleop with actual production statements.
- Correct any discrepancies or missing amounts.
- Verification of reported monthly feed purchase values
- Compare feed purchase data in Aleop with received invoices or purchase orders.
- Correct any discrepancies or missing amounts.
- Review meeting with an advisor or representative (optional but recommended)
- Team suggestion: You could schedule a monthly meeting with your feed representative to review ration data. This recurring meeting will allow for structured and constructive discussions to identify potential adjustments or optimization opportunities.
By following this methodology each month, you ensure that your indicators remain accurate, relevant, and actionable for monitoring herd performance and supporting decision-making.
Types of Dairy Indicators
The Dairy Indicators module offers eight key indicators, providing an overall view of production. Each of these indicators summarizes the herd’s main data to effectively monitor the farm’s performance.
Warning: Any interpretation of this data should be done in consultation with a field expert.
Yearly food margins by cow
The yearly food margins by cow includes all costs related to feeding the herd, whether forage, grains, concentrates, or other products—whether purchased or produced directly on the farm.
This margin is calculated over a rolling 12-month period. In other words, each bar on the chart represents data from the last 12 months, and this period shifts forward each month.
Example: In August 2025, the data analyzed covers September 2024 to August 2025. The following month, it will cover October 2024 to September 2025, and so on.

How to read the chart
- Black dots represent the annual gross feed margin per cow. This corresponds to revenue from milk sales minus feed expenses.
- Bars show the adjusted feed margin, keeping the milk price constant based on the reference month (the one shown on the left side of the table). This approach makes it possible to focus solely on variations related to feeding, herd management, environment, genetics, and other factors—without being influenced by fluctuations in milk price.
This distinction clearly identifies what is impacting the margin: milk price or feed performance.
Example #1: Milk price increases, but feed costs also increase. The black dot remains stable (since the two effects offset each other). The bar decreases, revealing a decline in herd performance.
Example #2: Milk price decreases, but feeding remains efficient. The black dot decreases (due to the milk price). The bar remains stable, indicating that feed performance is not the issue.
Yearly sales margin by kilogram of fat
The yearly sales margin by kilogram of fat is based on the same principle as the annual feed margin per cow: it is calculated over a rolling 12-month period. The difference lies in the divisor used: here, the calculation is based on kilograms of fat rather than the number of cows.
This indicator includes a feed margin calculated using a standardized milk price, making it a particularly relevant tool for evaluating feed management, herd management, environment, genetics, and other herd-related factors—independent of market fluctuations.

How to read the chart
- Black dots represent the annual margin per kilogram of fat held.
- Bars illustrate the annual margin per kilogram of fat produced.
Comparing these two data points helps to better understand the farm’s production margin tolerance expressed in days (e.g., -15 days to +10 days).
Interpreting the differences
- If the margin per kg of fat held is lower than the margin per kg of fat produced: The farm holds more quota than it produces. It is therefore reducing its production tolerance.
- If the margin per kg of fat held is higher than the margin per kg of fat produced: The farm produces more quota than it holds. It is therefore increasing its production tolerance.
Alimentation cost ventilation per hectolitre produced
This indicator allows you to assess the herd’s feed expenses relative to milk production, expressed in hectolitres. All feed-related costs are included, whether the products are purchased or produced on the farm.

What’s included:
- Concentrates, forage, and grains, regardless of their source (purchased or home-produced).
- Heifer feed, which is also included in the calculation.
How prices are determined:
- Forage prices are standardized for all producers and adjusted monthly by the Aleop team.
- Grains produced on the farm are valued at market price, revised each month. Aleop treats these grains as if they are “sold” to the herd at the current market price, just like forage.
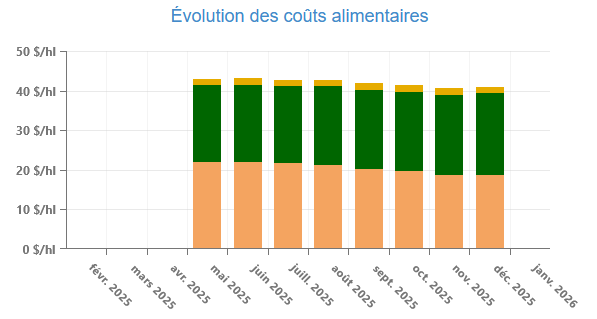
Alimentation cost evolution
This indicator allows you to track real-time trends in feed cost per hectolitre of milk produced. Each bar on the chart represents a cost calculated using a 12-month moving average, which smooths out seasonal fluctuations and highlights underlying trends.
This approach makes it easy to identify changes over time—whether an improvement or deterioration in the ratio—and adjust strategies accordingly.
Kg of fat / cow / day (yearly)
This indicator makes it possible to analyze changes in the productivity of lactating cows by measuring the amount of fat produced per cow, per day, expressed in kilograms.

Le graphique présente deux types de données :
- Bars show annualized results using a 12-month moving average, which helps smooth out seasonal effects and highlight underlying trends.
- Black dots represent monthly data, offering a more detailed view of short-term fluctuations.
This dual perspective makes performance easier to interpret and allows for quickly identifying periods of growth or decline.
Kg of fat + proteins / cow / day (yearly)
This indicator provides a complementary measure of the productivity of lactating cows by quantifying the combined daily production of fat and protein per cow, expressed in kilograms.

The chart offers two levels of interpretation:
- Bars correspond to annualized data, calculated using a 12-month moving average, making it possible to highlight underlying trends while smoothing out seasonal variations.
- Black dots illustrate the monthly results, providing a more precise view of short-term fluctuations.
This combination makes it possible to assess the herd’s overall performance while quickly detecting significant changes in production.
Liters of milk / cow / day (yearly)
This indicator illustrates the evolution of cow productivity by measuring the average quantity of milk produced per cow, per day.

As with the previous indicators:
- Bars epresent annualized data, calculated using a 12-month moving average, which highlights underlying trends while smoothing out seasonal variations.
- Black dots correspond to monthly data, providing a more precise view of short-term fluctuations.
This monitoring makes it possible to assess herd performance and quickly identify periods of improvement or decline.
Alimentation efficiency (yearly)
Feed efficiency measures the quantity of milk produced per kilogram of dry matter consumed.
It helps assess how effectively feed is converted into milk production.

A high value (between 1.4 and 1.6) indicates good feed conversion, while a value below 1.3 may reveal an imbalance in the ration, a decrease in forage quality, or health issues within the herd.
Important: Interpretation of this data should always be done in collaboration with a dairy advisor or a feed expert.