Our solutions
 Integrations
 Acomba
 SigaFinance
 AgExpert
 Get a free demo
 Talk to an expert
 Automation
 Intelligent search and document filing
 Financial indicators
 Dairy Indicators
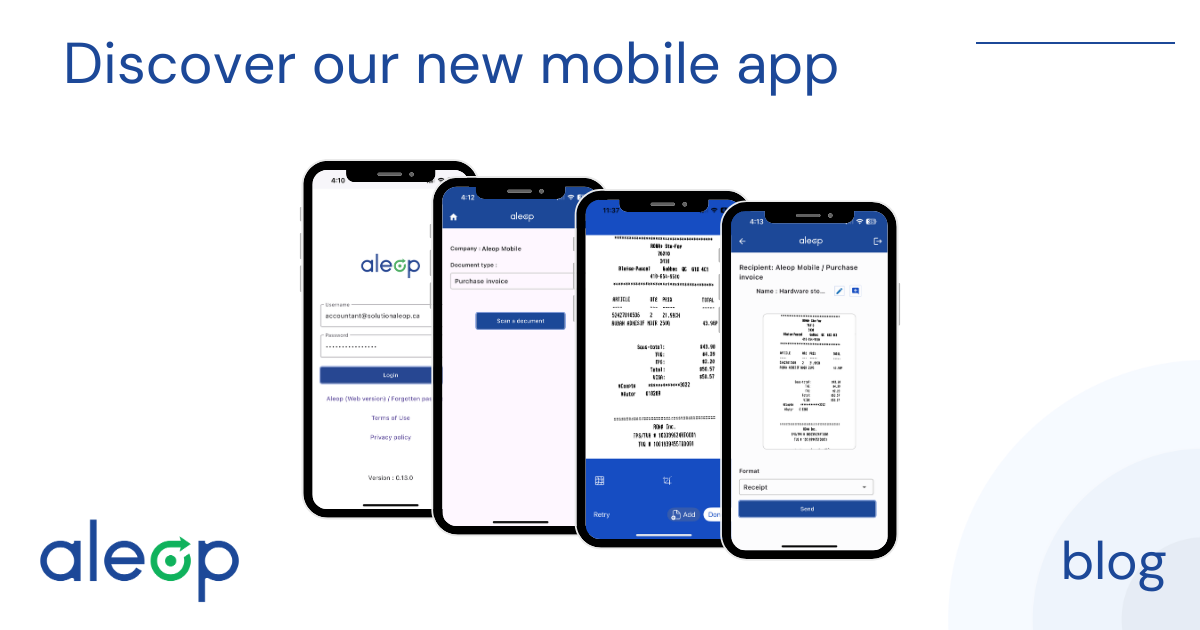
 Mobile app
 Data capture
 Intelligent data recognition
 Automatic transfer to your accounting software
 Electronic Data Interchange (EDI)
 Real-time dashboard
 12 months overview
 Personalized indicators
 Document digitization
 Seamless and secure integration
 Informative annotations
 Useful links
 Help & Support
 Blog
Blog Customer login
 FAQ
FAQ Technical support
 Contact us
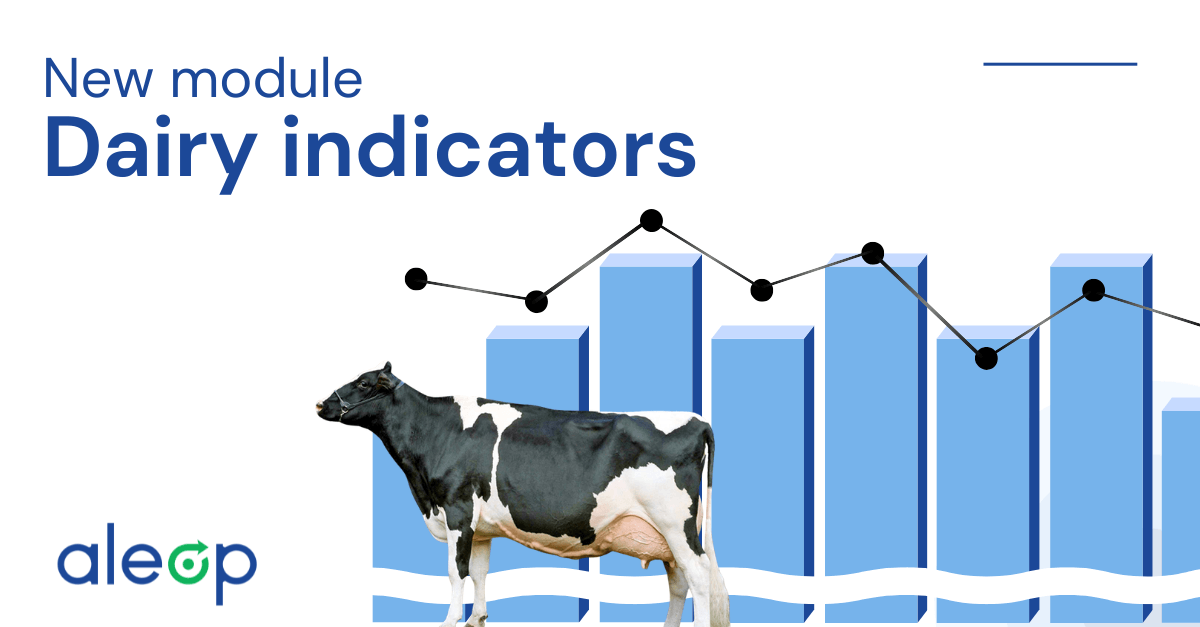
In dairy production, data is everywhere: production, components, feed, costs, rations. Yet it’s still often difficult to understand what truly impacts the profitability of the operation.
An increase in production does not automatically mean better margins. On the other hand, a drop in performance can sometimes go unnoticed for several weeks.
Aleop’s dairy indicators were developed to help producers more easily connect their technical data to their financial reality.

Gain clearer insight into what influences your results
On many farms, the information already exists. The challenge is often bringing it together and interpreting it quickly in order to make better decisions.
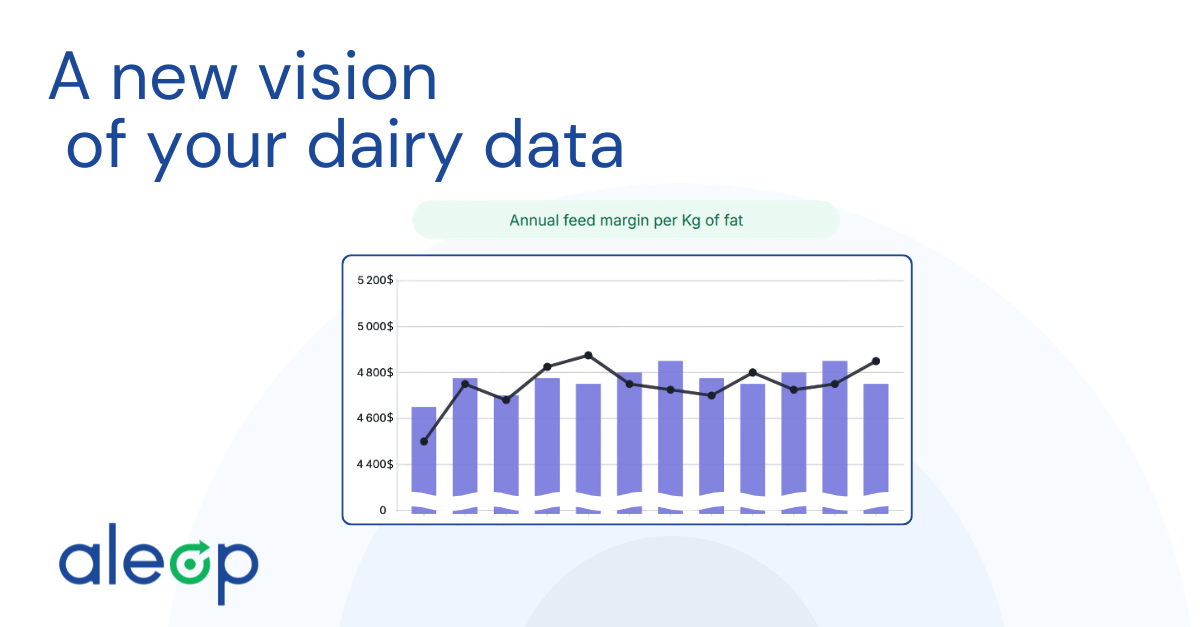
Dairy indicators provide a technical and financial view of the operation based on the farm’s real data.
They help, among other things, to:
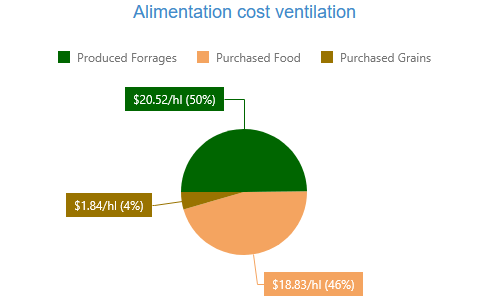
- Track changes in feed margins;
- Measure the impact of feed costs;
- Observe how milk components affect revenue;
- Distinguish market effects from those related to farm management.
The goal is not to generate more reports, but to better understand what the numbers are really revealing.
Separate milk price from actual performance
When revenue increases, it can be difficult to determine whether the improvement comes from:
- improved herd performance;
- a change in the ration;
- or simply more favorable market conditions.
On the other hand, certain technical decisions can reduce profitability without it being immediately visible in the overall results.
The indicators help put these elements into perspective in order to better understand what truly influences the operation’s margins.
Data directly connected to accounting
The indicators are built directly from the farm’s financial and technical-economic data.
Unlike manual compilations or analyses based on averages, the results reflect the reality of each individual operation.
The indicators use a “rolling 12-month cumulative” approach. In practical terms, each new month added replaces the oldest month in order to maintain an always up-to-date annual view.
This approach makes it easier to track trends and prevents a single atypical month from overly influencing the overall analysis.
Simple monitoring available throughout the year
Since the financial data is already integrated into the platform, very little manual work is required to obtain the results.
In just a few minutes each month, it becomes possible to track margin trends and quickly identify significant changes within the operation
The goal is simple: spend less time compiling information and more time analyzing the results.
How it plays out on the farm
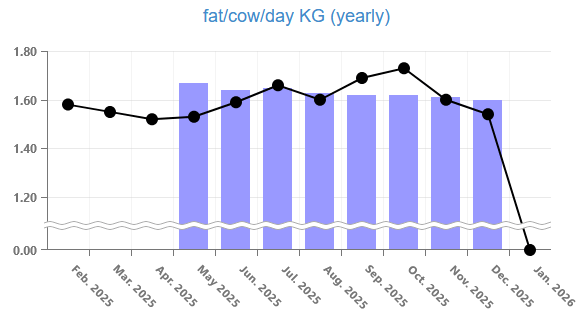
At a dairy operation using Aleop indicators, a ration adjustment led to a decrease in milk fat and non-fat solids.
Because the impact quickly became visible in the technical-economic indicators and feed margins, the operation was able to intervene within just a few weeks and make the necessary adjustments.
By connecting technical data with financial results, it becomes easier to detect certain changes more quickly and better measure the real impact of decisions made within the operation.
A tool to support discussions
The indicators do not replace the expertise of advisors and professionals who support operations.
Rather, they help support discussions with structured, consistent data that is directly tied to the farm’s financial reality.
By bringing a clear view of results and trends, discussions often become simpler and more effective.

Better understanding what your numbers reveal
The data already exists within agricultural operations. What is often missing is the ability to quickly connect it to the farm’s actual profitability.
Aleop dairy indicators aim to provide a clearer view of the operation by combining financial data and technical-economic data within a single tool.
In just a few minutes, see what your numbers really reveal.
Plan a demo with our team.
Need more informations?
Visit the Aleop Facebook page or dial 1-855-484-4040 for support.
Other articles